4.1. Yule Walker example
The following example illustrate the usage of the aryule() function that allows you to estimate the autoregressive coefficients of a set of data. First, we need some packages:
from pylab import *
import scipy.signal
from spectrum import *
Then, we define a list of AR filter coefficients:
a = [1, -2.2137, 2.9403, -2.1697, 0.9606]
and create some noisy data with them:
y = scipy.signal.lfilter([1], a, randn(1, 1024))
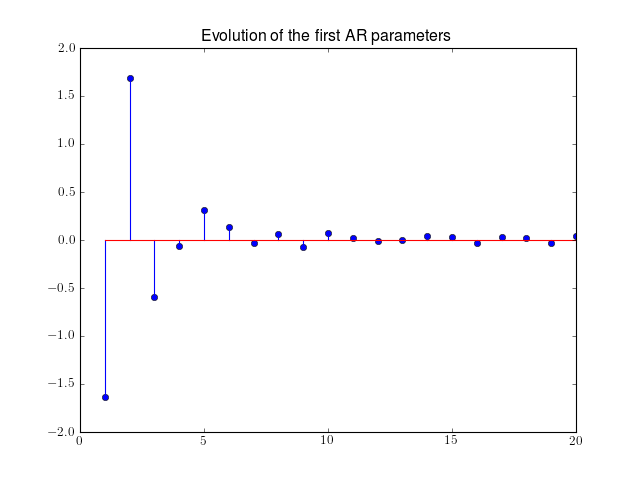
This array will be our data to test the Yule-Walker function, namely aryule(). Our goal is to estimate the AR coefficients from y. Since, we do not know the order of the autoregressive estimate, we first start by setting the order to 20:
ar, variance, coeff_reflection = aryule(y[0], 20)
By looking at the coeff_reflection output, it appears that the AR coefficient are rather small for order>4 (see following plot). From the plot, chosing an order 4 seems a reasonable choice.
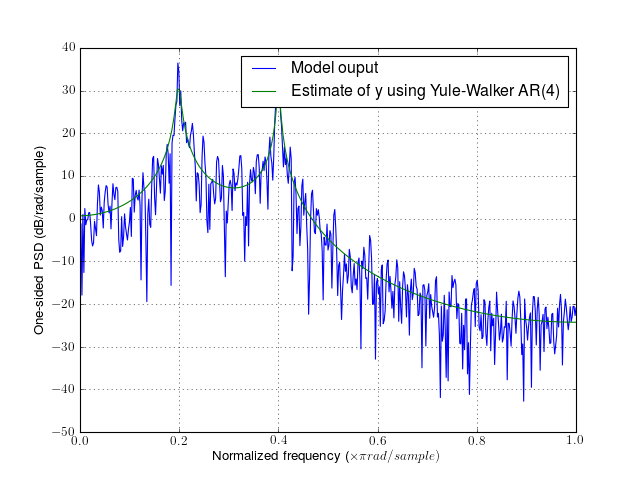
It is possible to plot the PSD from the ar values using this:
from pylab import *
import scipy.signal
from spectrum import *
# Create a AR model
a = [1, -2.2137, 2.9403, -2.1697, 0.9606]
# create some data based on these AR parameters
y = scipy.signal.lfilter([1], a, randn(1, 1024))
# if we know only the data, we estimate the PSD using Periodogram
p = Periodogram(y[0], sampling=2)  # y is a list of list hence the y[0]
p()
p.plot(label='Model ouput')
# now, let us try to estimate the original AR parameters
AR, P, k = aryule(y[0], 4)
PSD = arma2psd(AR, NFFT=512)
PSD = PSD[len(PSD):len(PSD)/2:-1]
plot(linspace(0, 1, len(PSD)), 10*log10(abs(PSD)*2./(2.*pi)),
    label='Estimate of y using Yule-Walker AR(4)')
xlabel(r'Normalized frequency (\times \pi rad/sample)')
ylabel('One-sided PSD (dB/rad/sample)')
legend()
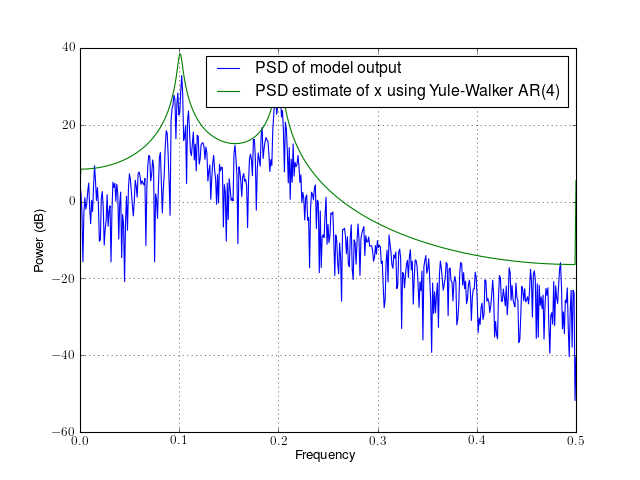
This example uses the functional approach. Again, it is recommended to use the object approach with an instance from pyule (see quickstart section). The previous example would become even simpler:
from pylab import *
import scipy.signal
from spectrum import *
a = [1, -2.2137, 2.9403, -2.1697, 0.9606]
y = scipy.signal.lfilter([1], a, randn(1, 1024))
p = Periodogram(y[0])
p();
p.plot()
p = pyule(y[0], 4)
p()
p.plot()
legend(['PSD of model output','PSD estimate of x using Yule-Walker AR(4)'])